I found this lab to be a fun exercise. As a land surveyor I have dealt with a few images in AutoCad but this seemed to be much easier with the Arc Georeferencing tools. I also liked experiementing with the control links. The only item that I couldn't get to come into compliance was a round object in the southwest quadrant of the south image.
Friday, February 26, 2010
Wednesday, February 24, 2010
Lab 5-Update Volusia County
PLEASE USE THIS SUBMISSION FOR LAB 5-DOQQ-DEM-DRG FILES!
Since we were granted extended time for the Lab 5 submission, I attempted again to get some files that I could get into my Volusia County mapping. As you can see by my last post I struggled to get this final map to come in on the correct projection and went ahead and posted my maps but were not projected into the correct system But now I have it correct! I had to find another file set that I could manipulate.
THE FIRST TWO MAPS ARE STILL FOR MY SUBMISSION FOR LAB 5.
THANKS FOR THE TIME EXTENSION--THIS LAB WAS A REAL BOOGER. HOPEFULLY I LEARNED ALOT.
Sunday, February 21, 2010
Lab 5-GIS Data Search
I spent countless hours trying to get the DOQQ-DRG-DEM to all get in the same system. I had a lot of trouble getting the DEM files to convert from SDTS to DDF and then into ARCMap.
Gotta Go. Time to Post
A real hard Lab!!!
Wednesday, February 10, 2010
Haiti Earthquake Post-Week 4
I obtained this map from the NY Times. I liked it as it had a humanitarian slant to it. I thought it was easy to read and gives some back ground on the affected areas. It mainly focuses on the challenges facing relief workers to get aid to the people after the earthquake. I also thought the map maker(s) used a nice color scheme and appropriate symbolization to help the viewer in understanding the magnitude of the disaster.
Tuesday, February 9, 2010
Lab 4-Projections & Area Comparison
For the most part this lab exercise was pretty straight forward as the instructions were clear and with being a land surveyor, I've had some experience with projections. However the sequence for changing projections within ArcMap will take some practice! I struggled some with adding the jpeg layer and had a hard time bringing it to the top so that it was visible. I also spent some time with the legend but I believe it shows the proper information.
Monday, February 1, 2010
Week 3-GIS Cartography-Mexico
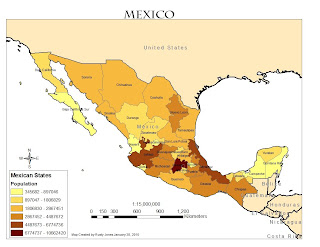
Mexico Population-Map 1
I thought the instructions to produce this map were straight forward but spent the most time picking colors. I also got a feel for the SQL Query.
Central Mexico-Map 2
The thing I learned the most was converting the labels to annotation and the symbology tab. I also spent some time working with the scales and how to remove the RANK from the legend of the rivers portion. I wasn't able to get it to be like the other portions of the legend but I was able to rename it so it made some sense.
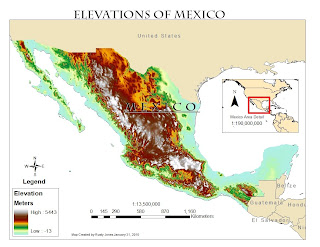
Elevations of Mexico-Map 3
In this exercise I learned the difference between stretched and classified symbology. I spent the most time testing colors for the countries and a graduated look that wasn't to awful to look at. I wanted to create elevations that ended with the highest elevations being white. I thought this made the most sense as the highest elevations would have snow, especially as there are some peaks in Mexico over 17,000 ft. high.
Subscribe to:
Posts (Atom)


