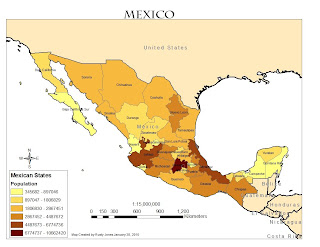
Mexico Population-Map 1
I thought the instructions to produce this map were straight forward but spent the most time picking colors. I also got a feel for the SQL Query.
Central Mexico-Map 2
The thing I learned the most was converting the labels to annotation and the symbology tab. I also spent some time working with the scales and how to remove the RANK from the legend of the rivers portion. I wasn't able to get it to be like the other portions of the legend but I was able to rename it so it made some sense.
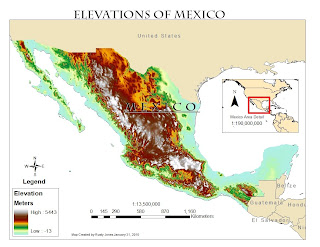
Elevations of Mexico-Map 3
In this exercise I learned the difference between stretched and classified symbology. I spent the most time testing colors for the countries and a graduated look that wasn't to awful to look at. I wanted to create elevations that ended with the highest elevations being white. I thought this made the most sense as the highest elevations would have snow, especially as there are some peaks in Mexico over 17,000 ft. high.
Monday, February 1, 2010
Subscribe to:
Post Comments (Atom)


No comments:
Post a Comment