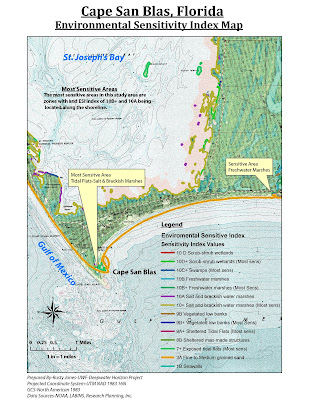
Cape San Blas, Florida--Map No. 41
Part 1
Google Earth-Fishing Closure May 25, 2010
I orginally had some issues with the projection and tracing operations in developing this map, but in the end I believe it all came together. I learned a lot on checking my data.
Environmental Sensitive Mapping-ESI Index Mapping

This weeks submittal had a number of challenges and opportunities for learning. The first challenge was getting the DRG Quad map file to project correctly. It took quite some time and eventually, I went back and changed the projection for the whole project to NAD 83-UTM-16N. After the change, the quad file came into the project correctly but the graphic display was really terrible and very grainy. After seeing this I went back to LABINS and downloaded the DOQQ files for the study area. The files downloaded and projected seemlessly. When I was nearly completed with the project, I tested an export of the DRG file and found that it exported fine. I'm not sure why it looks terrible in the drawing but fine in a jpeg export. After seeing this I went back and reworked all of my maps to display the DRG, as the project requirements requested. I did include one of the DOQQ files for reference. One thing that I noticed was the beach at Cape San Blas has eroded since the DRG-Quad was mapped. Interesting! If I had the project to do over again, I would perhaps pick an area that had a larger population area. I was a bit surprised that there wasn't more booming planned for the area, but perhaps there are higher priority areas? I also would have liked to add more graphs and tables, but ran out of time with nearly 50+ hours into the whole project.


No comments:
Post a Comment